Conversions Reports
The Conversions report shows how events and page visits translate into measurable results for your website. Use this report to track the completion of your defined goals.
A “conversion” happens every time a visitor completes an action that you’ve defined as a Goal. This could be anything from a form submission to a key product page view. This guide will walk you through your WordPress conversion report to help you understand and act on your most valuable data.
Overview Tab
The Overview tab provides a high-level summary of your website’s overall conversion performance.
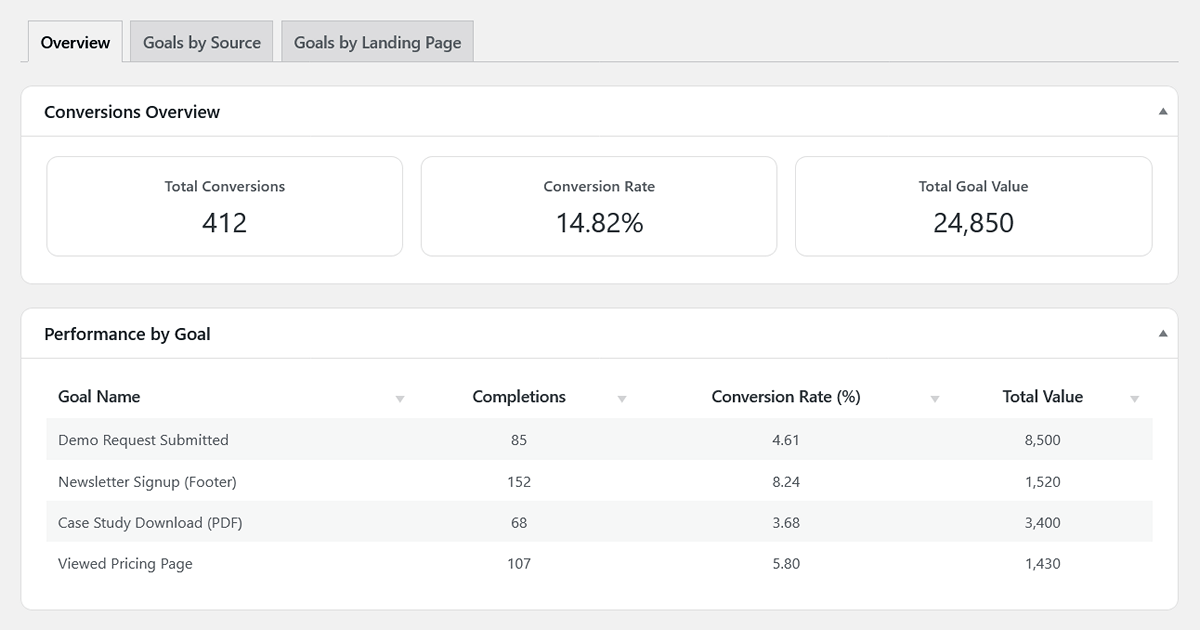
Conversion Highlights (Scorecards)
- Total Conversions: The total number of times any of your defined goals have been completed in the selected period.
- Conversion Rate: This is a crucial metric. It’s the percentage of total visits (sessions) in which at least one goal was completed. A higher conversion rate indicates that a larger percentage of visits result in completed goals.
- Total Goal Value: The sum of all values you have assigned to your completed goals. This allows you to quantify the impact of different conversions and understand the total “value” generated by your website’s actions.
Performance by Goal Table
This table breaks down the performance of each individual goal you’ve created. It helps you understand which of your objectives are being met most successfully.
- Goal Name: The name you gave your goal in the settings.
- Completions: The total number of times this specific goal was completed.
- Conversion Rate (%): The percentage of total visits that resulted in a completion of this specific goal.
- Total Value: The total value accumulated for this specific goal (Completions × Goal Value).
Goals by Source Tab
This report is essential for understanding your marketing effectiveness. It answers the question: “Which traffic sources are sending visitors who actually convert?”
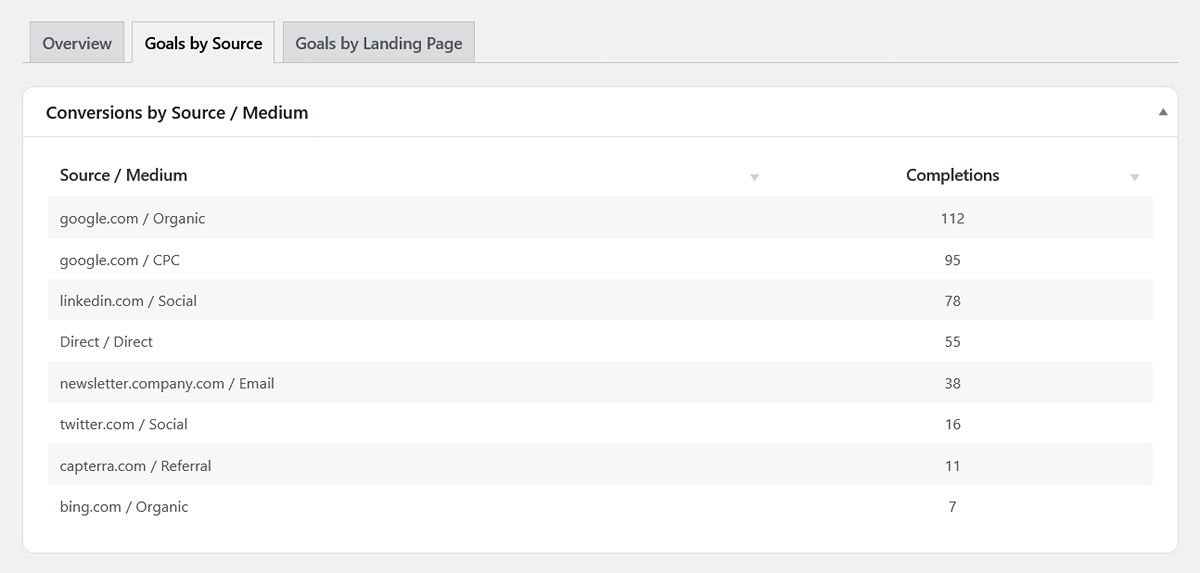
The table lists your traffic sources (e.g., google.com / organic, linkedin.com / social) and shows the total number of goal completions attributed to visitors who started their session from that source.
How to Use This Data: This report is your guide for where to invest your marketing time and money. If you see that google.com / cpc is driving a high number of conversions, you know your Google Ads are working. If a specific referring blog is sending traffic that converts, it might be a great partner for future collaborations.
Goals by Landing Page Tab
This report helps you optimize your website’s content and user flow. It answers the question: “Which of my ‘front door’ pages are best at starting a user on a journey that leads to a conversion?”
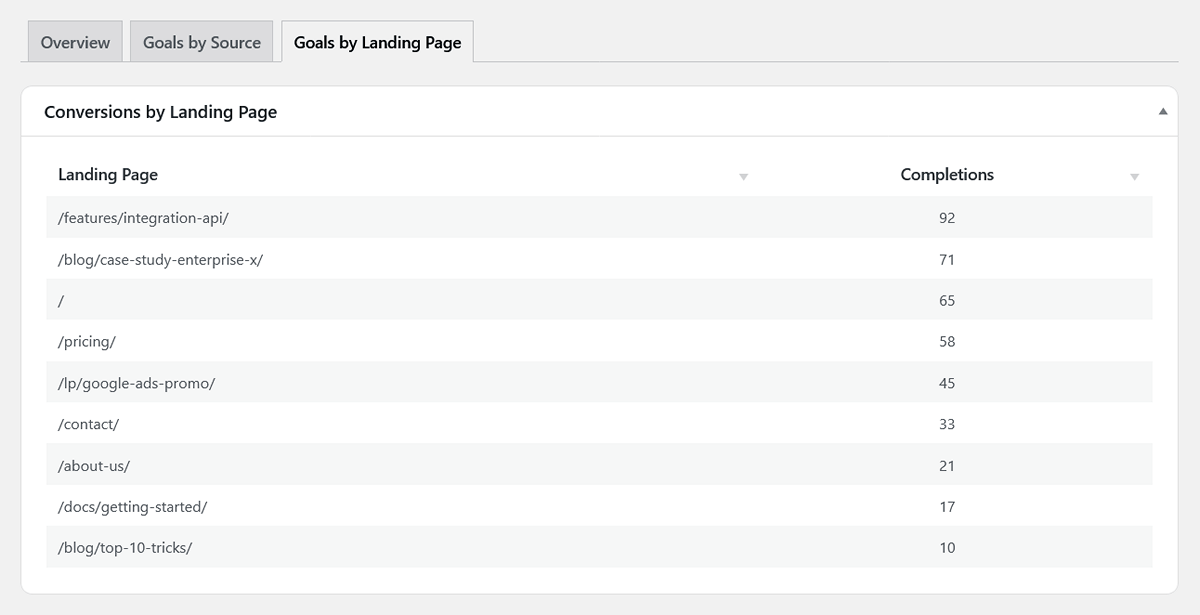
The table lists the pages where visitors most often begin their sessions and shows the total number of goal completions that occurred within those sessions.
How to Use This Data: A landing page with a high number of visits but a low number of conversions might need improvement. Conversely, a landing page with a high number of conversions indicates strong performance. Review its design and content to improve other pages on your site.
How to Set Up Goals
Ready to start building your own WordPress conversion report? Setting up goals is a simple two-step process:
- First, ensure the action you want to track is being recorded. This can be a page visit (which is tracked automatically) or a custom interaction that you’ve set up via our No-Code Event Tracker.
- Then, go to Settings > Goals & Conversions and define your goal by telling the plugin which page visit or event counts as a success.
For a full walkthrough, please see our detailed Settings Guide.