Using The Reports
Reports are the heart of WP Insights Pro. This is where raw data is transformed into clear, actionable insights about your website. This guide serves as a central hub. Click on any report below to jump to a detailed breakdown of its features, tables, and charts.
The Reporting Interface: Core Features
Before diving into specific reports, let’s look at the tools available on report pages.
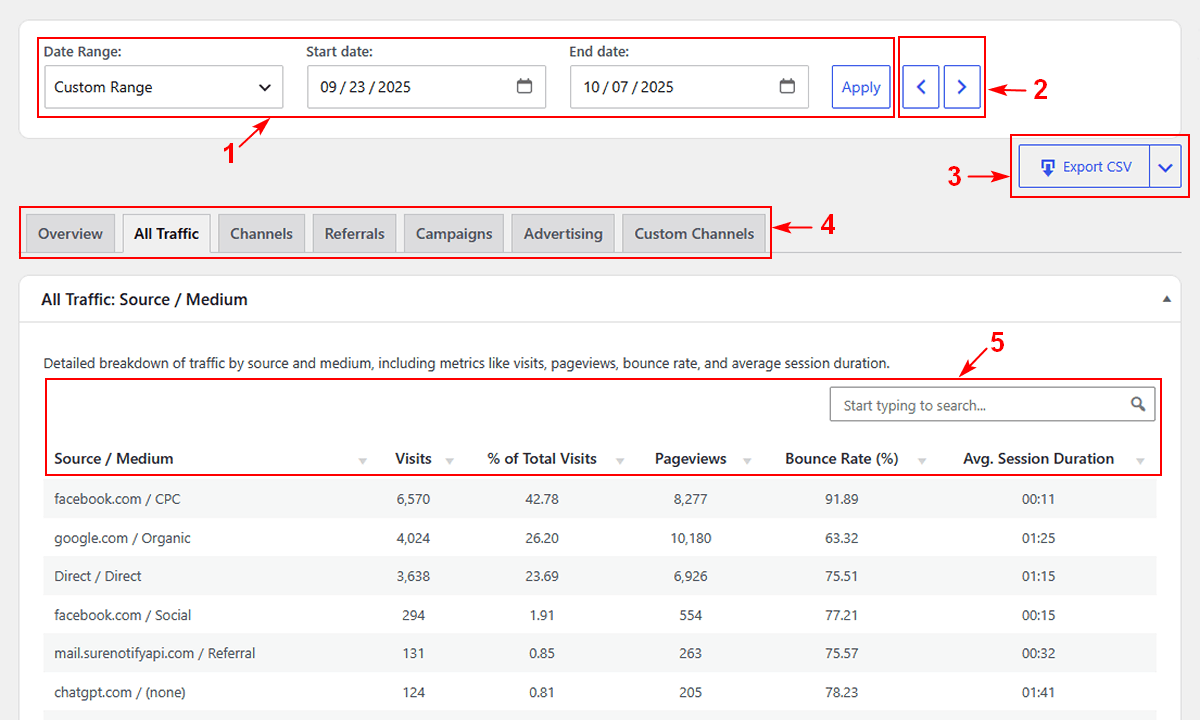
The Date Range Picker
This is your primary tool for exploring your data. You can select from a list of quick presets (like “Last 7 Days”), view a specific archived month, or define any custom date range for your analysis.
Period Navigation
Use the Previous (←) and Next (→) arrow buttons next to the “Apply” button for rapid period switching. If you are viewing “Last Month,” clicking “Previous” will instantly load the month before that. If you are viewing a custom 7-day range, it will jump to the prior 7-day period.
Export Data
Need to use your data elsewhere? The Export button provides three options for any report. You can Export a PDF to generate a clean, print-ready document of your current view. You can export a CSV file containing the data from your current table for use in spreadsheets. You can also export raw JSON, which includes the full data for the report section (for example, all Audience data, not only the currently displayed table), for use in external tools or integrations. For the Historical Trends report, both CSV and JSON exports include only the data shown in the current view.
Sub-Navigation Tabs
Most reports are organized into tabs to keep the information clean and focused. Click on a tab (e.g., “Geolocation,” “Technology”) to switch to that specific view without reloading the page.
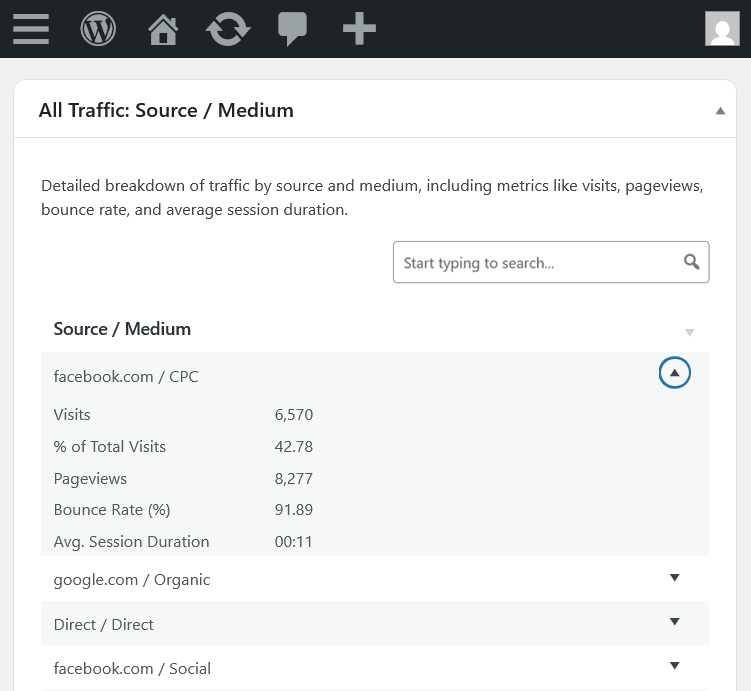
Interactive Tables
All data tables are interactive and designed for easy exploration. You can sort data by clicking any column header (click again to reverse the order) and quickly filter results using the search box above each table. On smaller screens, less critical columns collapse to preserve readability, while full row data remains accessible.
Your Analytics Reports: A Guided Tour
Click on any report below for a detailed guide on its specific metrics and features.
Dashboard
The Dashboard provides an overview of your metrics, including traffic trends and top content.
Audience Reports
Understand who your visitors are. Explore their geographic location, the technology they use, and when they are most active.
Acquisition Reports
Discover how visitors find your site. Analyze your traffic sources, marketing campaigns, and advertising channels.
Content Reports
Learn what content resonates with your audience. Identify your most popular pages, best landing pages, and top exit pages.
Events Report
Track key user interactions beyond pageviews, such as button clicks, downloads, and form submissions.