Content Reports
You’ve seen who your visitors are and how they found you. The Content Reports answer the next important question: “What are they doing on my site?”
This is where you move beyond traffic numbers to truly understand your WordPress content analytics. You can identify your most viewed pages, top landing pages, and common exit pages. You can also analyze performance by author, post type, and taxonomy (such as categories and tags). This guide explains each tab in this section.
Overview Tab
This tab gives you a high-level summary of your content’s overall engagement and highlights your top-performing pages.
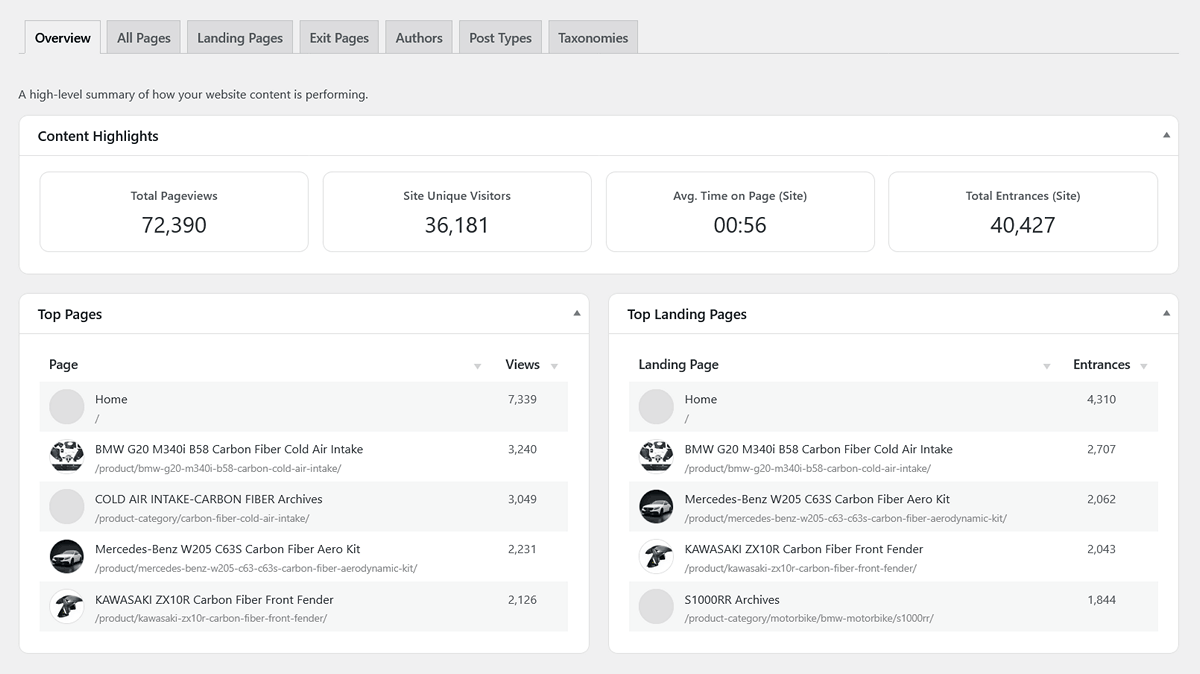
- Content Highlights (Scorecards):
- Total Pageviews: The raw count of all pages viewed in the period.
- Site Unique Visitors: The total number of distinct individuals who visited your site.
- Avg. Time on Page (Site): A weighted average of the time visitors spend on your pages. It only includes views where the visitor navigated to another page, giving you a more accurate measure of true engagement.
- Total Entrances (Site): The total number of sessions, equivalent to “Total Visits.”
- Top Pages & Top Landing Pages: These tables give you a quick look at your most important content.
- Top Pages: Your most viewed pages overall.
- Top Landing Pages: The pages where visitors most often begin their sessions.
All Pages Tab
This is the most comprehensive content report. It provides a detailed breakdown of performance and engagement metrics for every tracked page on your website, giving you a complete picture of your WordPress content analytics.
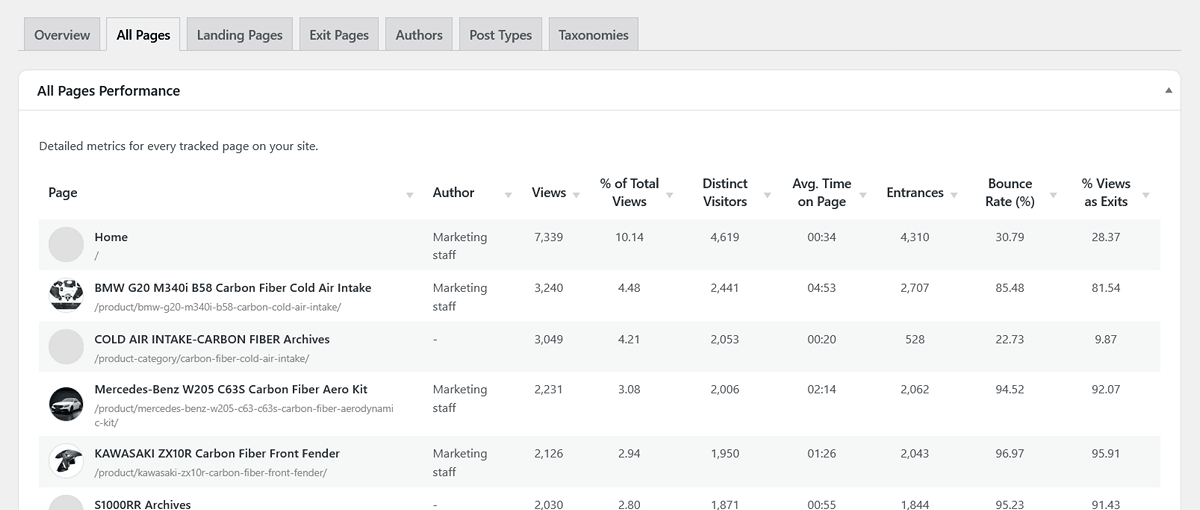
Here’s what each column tells you:
- Page: The title and URL path of the page. A featured image thumbnail is also displayed if available.
- Author: The name of the post’s author.
- Views: The total number of times this page has been viewed.
- % of Total Views: The percentage of your site’s total pageviews that this single page accounts for.
- Distinct Visitors: The number of unique individuals who have viewed this page.
- Avg. Time on Page: How long, on average, visitors spend on this page before navigating to another page. A high number here is a great sign of engaging content.
- Entrances: The number of times a session started on this page.
- Bounce Rate (%): For sessions that started on this page, this is the percentage of visitors who left your site without viewing a second page.
- % Views as Exits: Of all the times this page was viewed, this is the percentage of views that were the last one in a session.
Landing Pages Tab
This report focuses exclusively on your site’s “front doors.” It helps you answer: “Which pages are best at drawing visitors in and encouraging them to stay?”
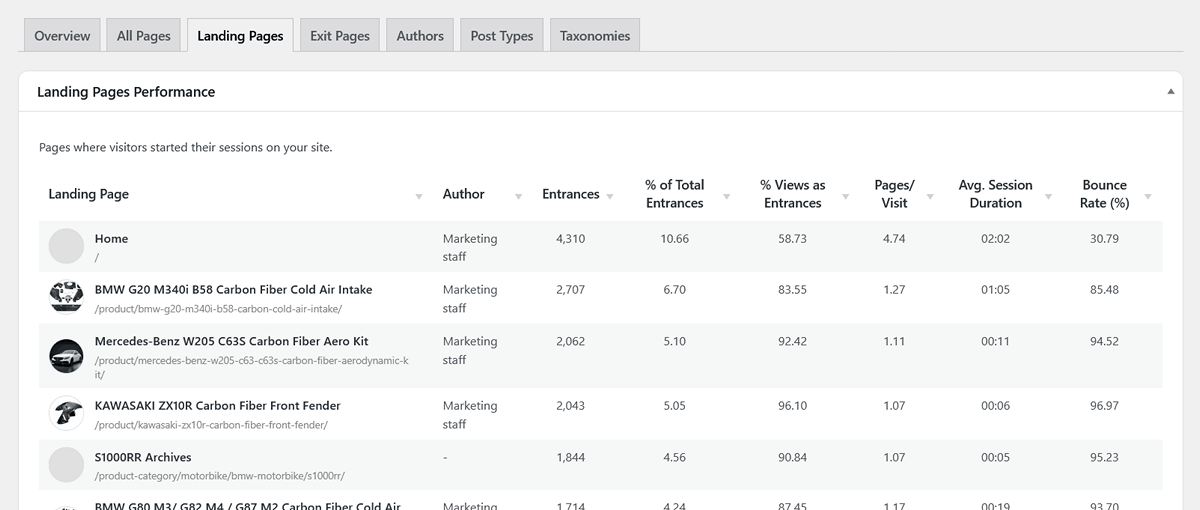
- Landing Page: The title and URL path of the page.
- Author: The name of the post’s author.
- Entrances: The number of sessions that started on this page.
- % of Total Entrances: What percentage of all your site’s sessions began on this specific page.
- % Views as Entrances: Of all the times this page was viewed, what percentage of those views were the start of a new session. A high number (e.g., 95%) means this page is primarily an entry point.
- Pages/Visit: The average number of other pages a visitor viewed in a session that started on this page. A high number is a great sign of a successful landing page.
- Avg. Session Duration: The average length of sessions that started on this page.
- Bounce Rate (%): The percentage of visitors who landed on this page and then left without any further interaction. A high bounce rate here might indicate a mismatch between what the visitor expected and what the page delivered.
Exit Pages Tab
This report shows you the last page a visitor saw before leaving your site. It helps you answer: “Where are people leaving from?”
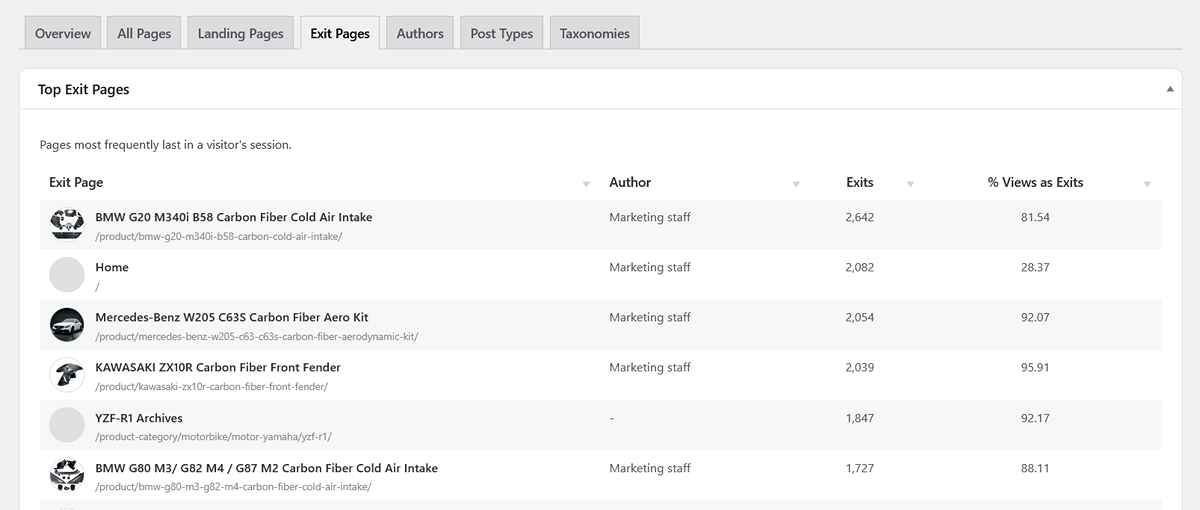
- Exit Page: The title and URL path of the page.
- Author: The name of the post’s author.
- Exits: The total number of times this page was the last page in a session.
- % Views as Exits: Of all the times this page was viewed, what percentage of those views resulted in the visitor leaving your site.
Pro Tip: A high exit rate isn’t always bad! For a “Contact Us” or “Thank You” page, a high exit rate is perfectly normal. However, if a key page in the middle of your sales funnel has a high exit rate, it could indicate a problem that needs investigation.
Authors Tab
This report displays performance metrics aggregated by post author.
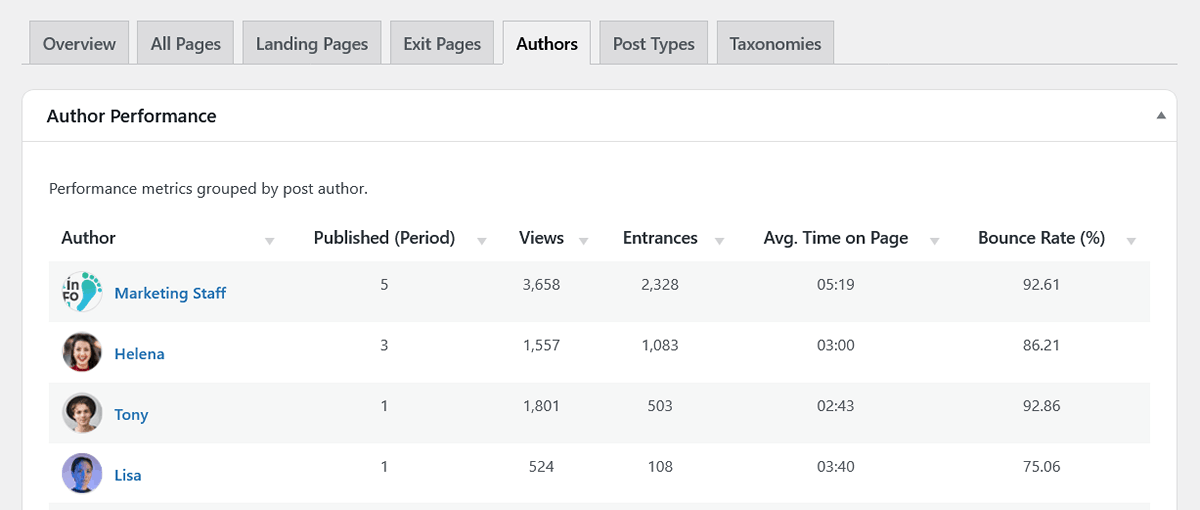
The main table lists all authors whose content received views during the selected period. The name of each author is a link to their individual performance dashboard. The columns include:
- Author: The author’s display name and Gravatar.
- Published (Period): The number of posts the author published within the selected date range.
- Views: The total number of views across all of that author’s posts.
- Entrances: The total number of sessions that started on one of this author’s posts.
- Avg. Time on Page: The weighted average time visitors spend on this author’s content.
- Bounce Rate (%): The bounce rate for sessions that started on this author’s content.
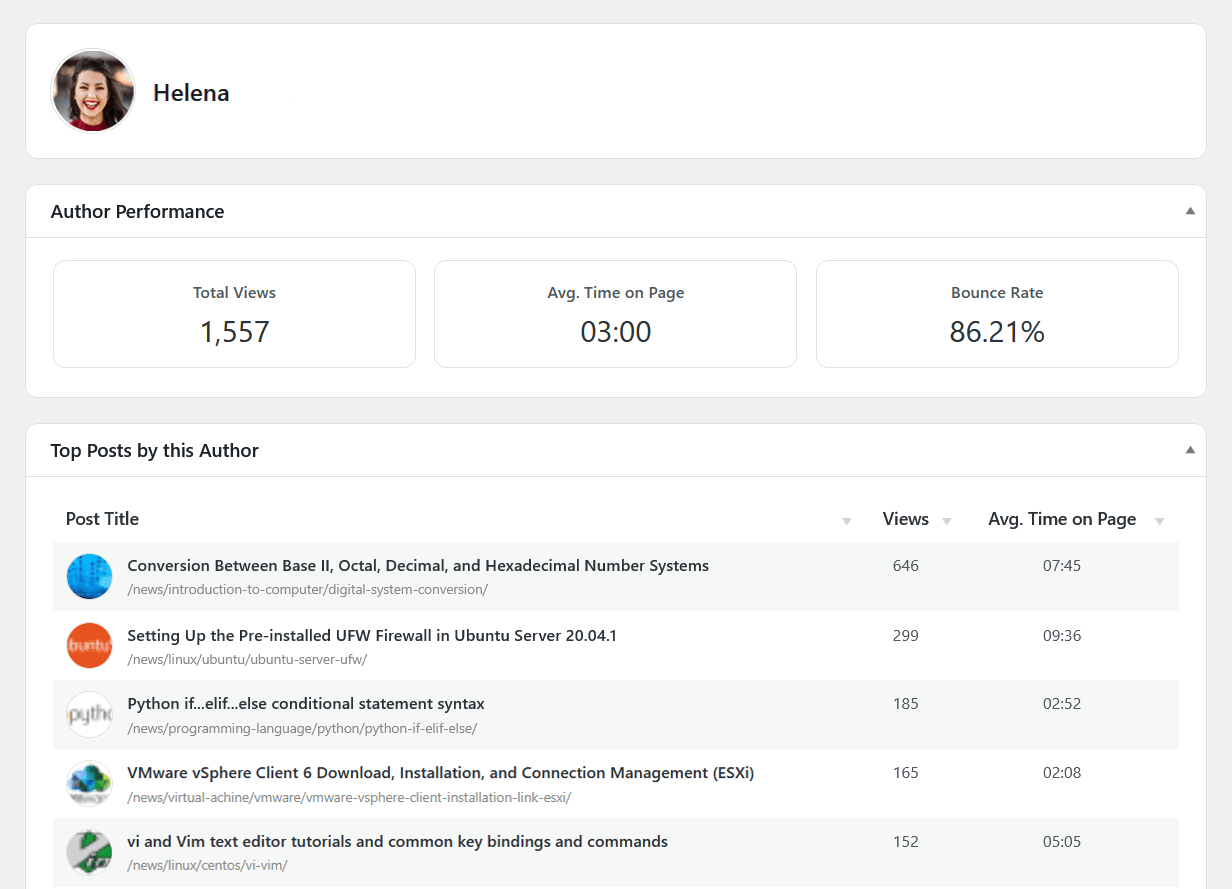
Single Author Dashboard
Clicking on an author’s name in the main table will take you to their individual performance dashboard. This view provides a breakdown of that author’s content, including scorecards for their key metrics and a table of their top-performing posts for the period.
Post Types Tab
This report displays performance metrics aggregated by content type on your site (e.g., Posts, Pages, Products, or Custom Post Types).
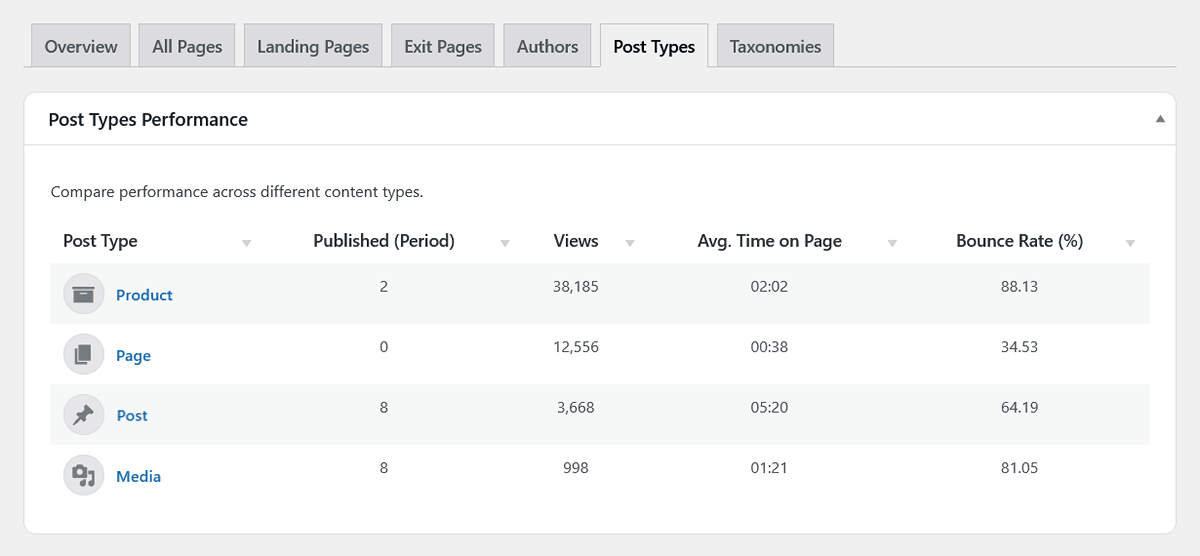
The main table lists all tracked post types and their aggregated performance metrics. Each post type name is a link that opens an individual dashboard. The columns include:
- Post Type: The name and icon of the post type.
- Published (Period): The number of items of this type published within the selected date range.
- Views: The total number of views across all items of that post type.
- Avg. Time on Page: The weighted average time visitors spend on content of this type.
- Bounce Rate (%): The bounce rate for sessions that started on an item of this post type.
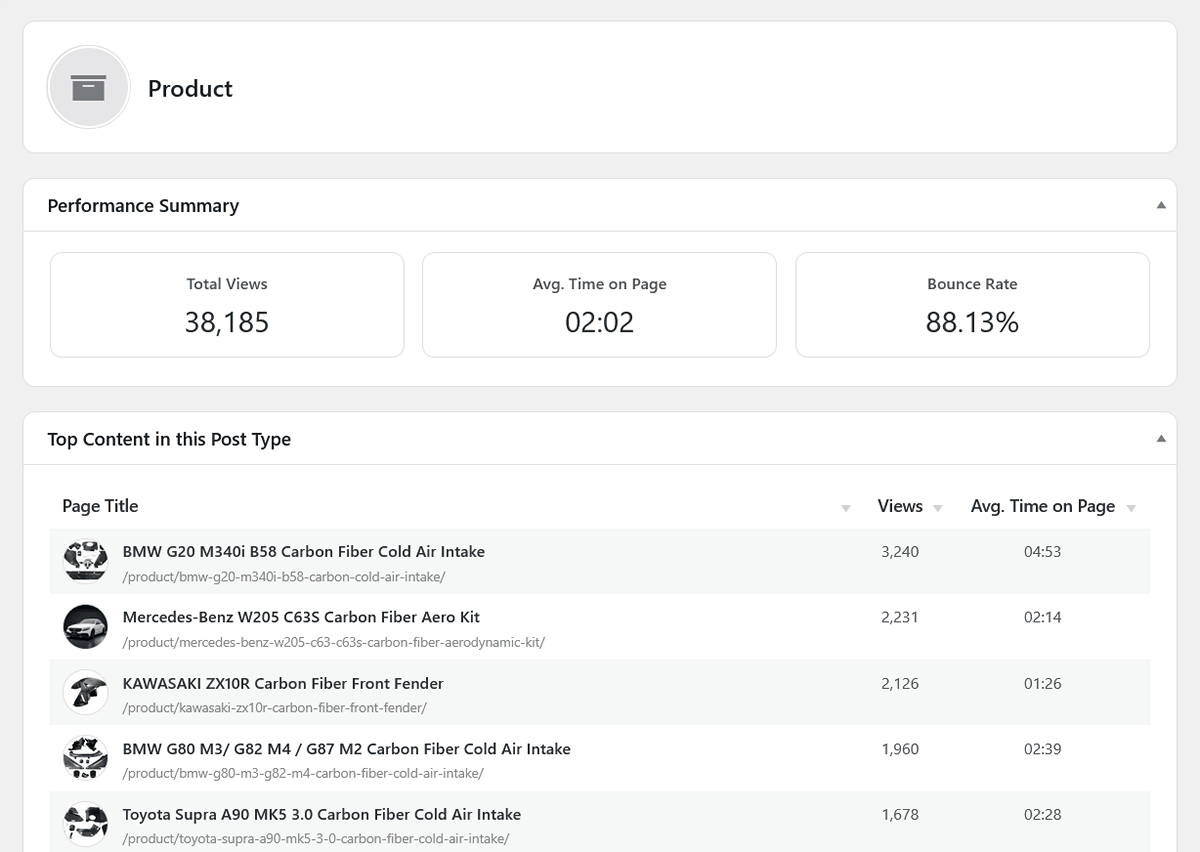
Single Post Type Dashboard
Clicking on a post type name in the main table will take you to its individual performance dashboard. This view shows performance scorecards and a list of the top-performing content within that post type.
Taxonomies Tab
This report helps you identify which topics generate the most engagement by examining the performance of your site’s taxonomies, such as Categories and Tags.
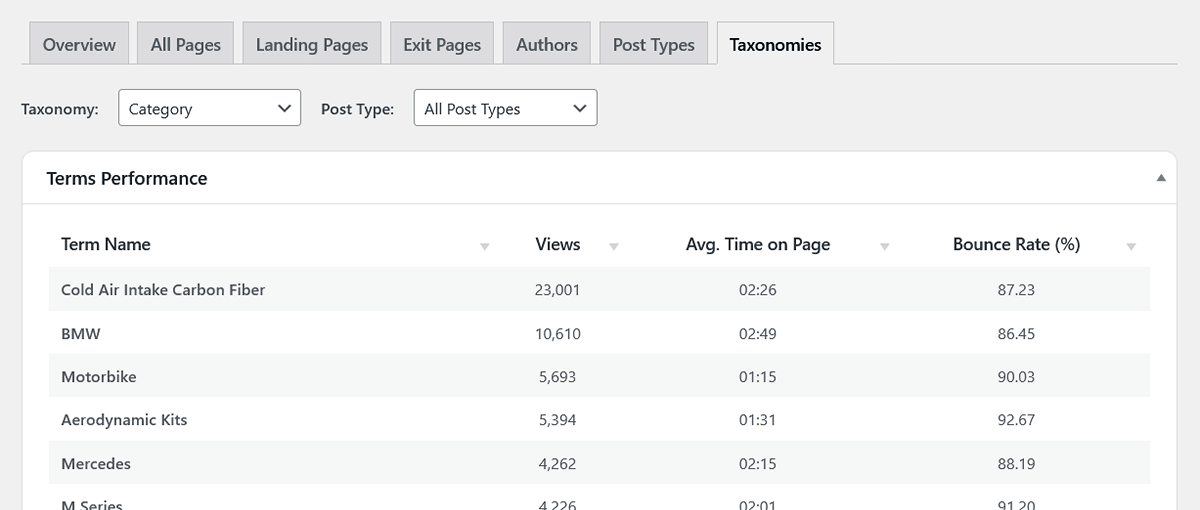
This view is interactive and includes two filter controls at the top:
- Taxonomy Selector: This dropdown is automatically populated with all taxonomies that have received traffic. Select the one you wish to analyze (e.g., “Categories”).
- Post Type Filter: This allows you to segment the data. For example, you can choose to see the performance of your “Categories” as they apply only to “Posts” or only to “Products.”
The resulting table lists each term (e.g., each specific category or tag) along with its aggregated performance metrics. The columns include:
- Term Name: The name of the specific category, tag, etc.
- Views: The total number of views for all posts associated with this term (within the selected filters).
- Avg. Time on Page: The weighted average time visitors spend on content associated with this term.
- Bounce Rate (%): The bounce rate for sessions that started on content associated with this term.
Next Steps
You now have a complete picture of your traffic and on-site content performance. The next step is to measure the specific interactions that matter most to your business.