Acquisition Reports
The Acquisition reports are designed to answer one of the most important questions for any website owner: “How are visitors finding my site?”
Understanding your WordPress traffic sources and which drive the most traffic is the first step in optimizing your marketing efforts. This guide will walk you through each tab of the Acquisition report, from the high-level overview to the granular details of your advertising campaigns.
Overview Tab
This tab provides a quick, visual summary of your main traffic drivers. It’s the place to get a high-level understanding of your acquisition strategy’s performance.
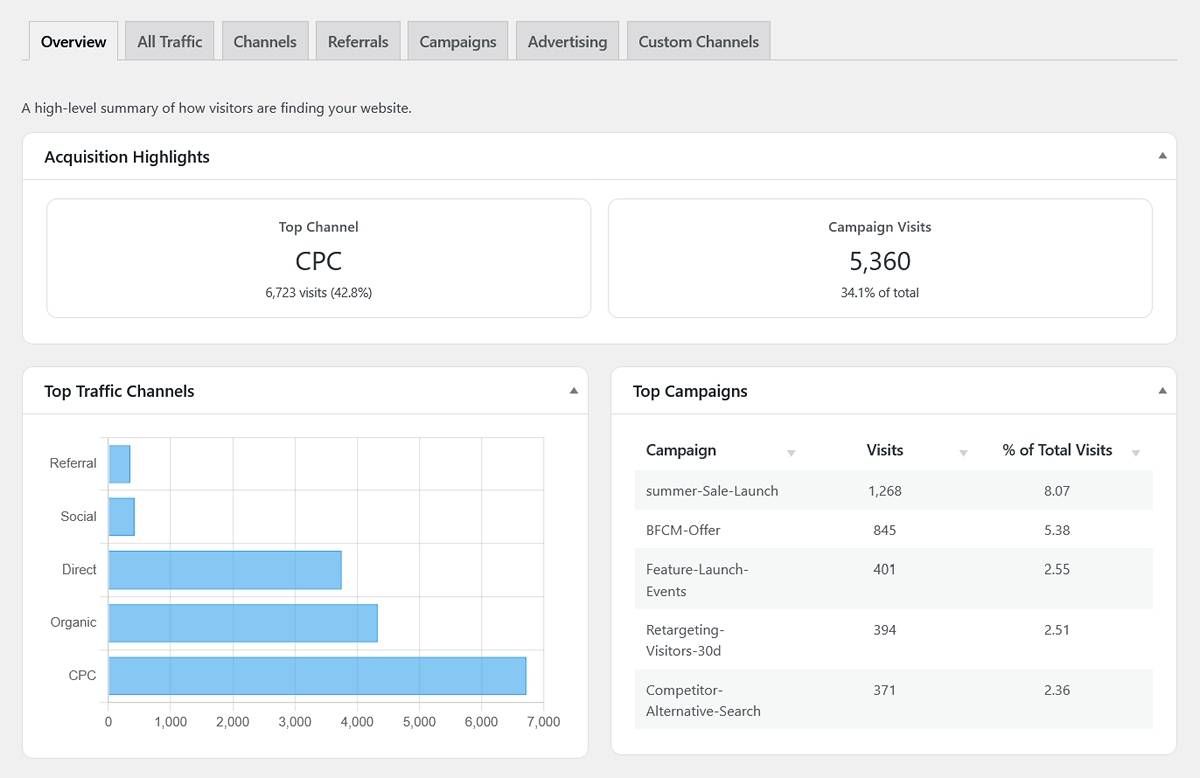
- Acquisition Highlights (Scorecards): These two scorecards give you immediate insight:
- Top Channel: Shows your single best-performing channel (e.g., Organic, Direct, CPC) along with the number of visits it generated and its percentage of your total traffic.
- Campaign Visits: Shows the total number of visits generated from all your tracked UTM campaigns combined.
- Top Traffic Channels Chart: This bar chart provides a visual breakdown of your primary acquisition channels, allowing you to easily compare their performance.
- Top Campaigns Table: A quick-reference list of your top-performing UTM campaigns, sorted by the number of visits they generated.
All Traffic Tab
This report gives you a detailed breakdown of your WordPress traffic sources by combining the Source (the “where,” like google.com) and the Medium (the “how,” like organic).
This is an important report that gives you a detailed, granular breakdown of your traffic by combining both the Source (the “where,” like google.com) and the Medium (the “how,” like organic).
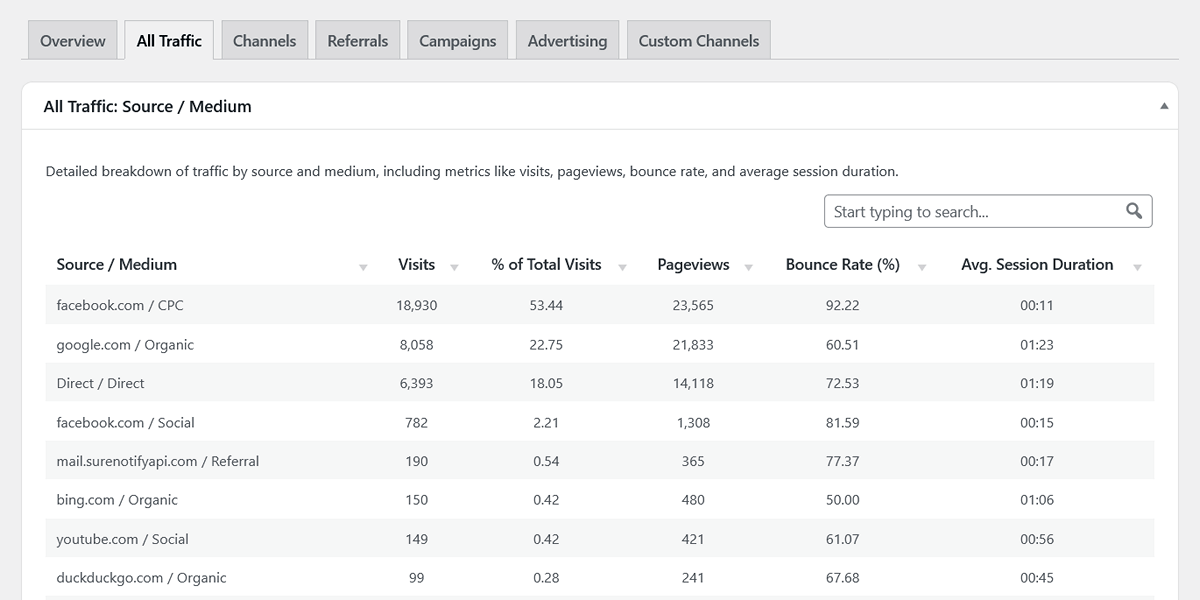
The table includes the following metrics for each Source/Medium pair:
- Visits: The total number of sessions from that specific source/medium.
- % of Total Visits: The percentage of your site’s total traffic that came from this source/medium.
- Pageviews, Bounce Rate (%), and Avg. Session Duration: Key engagement metrics to help you understand the quality of the traffic from each source.
Channels Tab
This report groups your traffic into broad, high-level marketing channels, making it easy to see your overall strategy at a glance. WP Insights Pro automatically categorizes your traffic based on the utm_medium tag or the referrer. The most common channels you’ll see are:
- Direct: Visitors who typed your URL directly or used a bookmark.
- Organic: Visitors from search engines like Google or Bing.
- Social: Visitors from social media platforms like Facebook, Twitter, or LinkedIn.
- Referral: Visitors who clicked a link on another website.
- CPC (Cost Per Click): Visitors from paid ad campaigns (e.g., Google Ads, Facebook Ads).
- Email: Visitors who clicked a link in an email newsletter.
You may see other channels in your report based on the specific utm_medium tags you use in your marketing campaigns (e.g., paid, affiliate, display).
Referrals Tab
This report shows you exactly which external websites are sending you traffic. Each row in the table is a specific Referring Domain (e.g., anotherblog.com, t.co) that linked to your site. This is helpful for identifying partnership opportunities and understanding your backlink profile.
Campaigns Tab
This tab is your command center for measuring the success of your specific marketing efforts. It displays all traffic that arrived on your site with utm_campaign parameters in the URL.
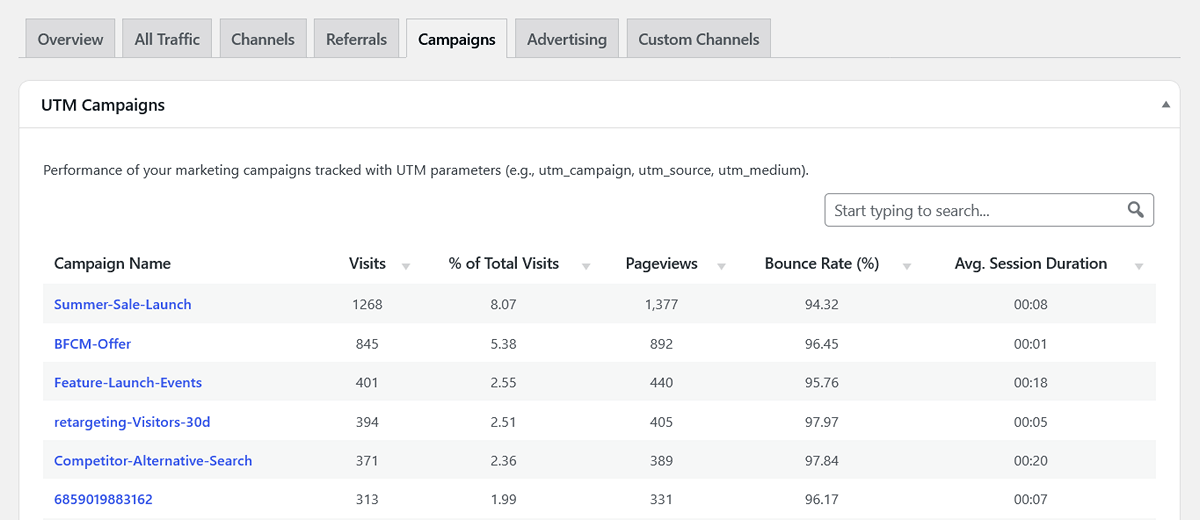
The main table shows the overall performance (Visits, Pageviews, Bounce Rate, etc.) for each campaign name.
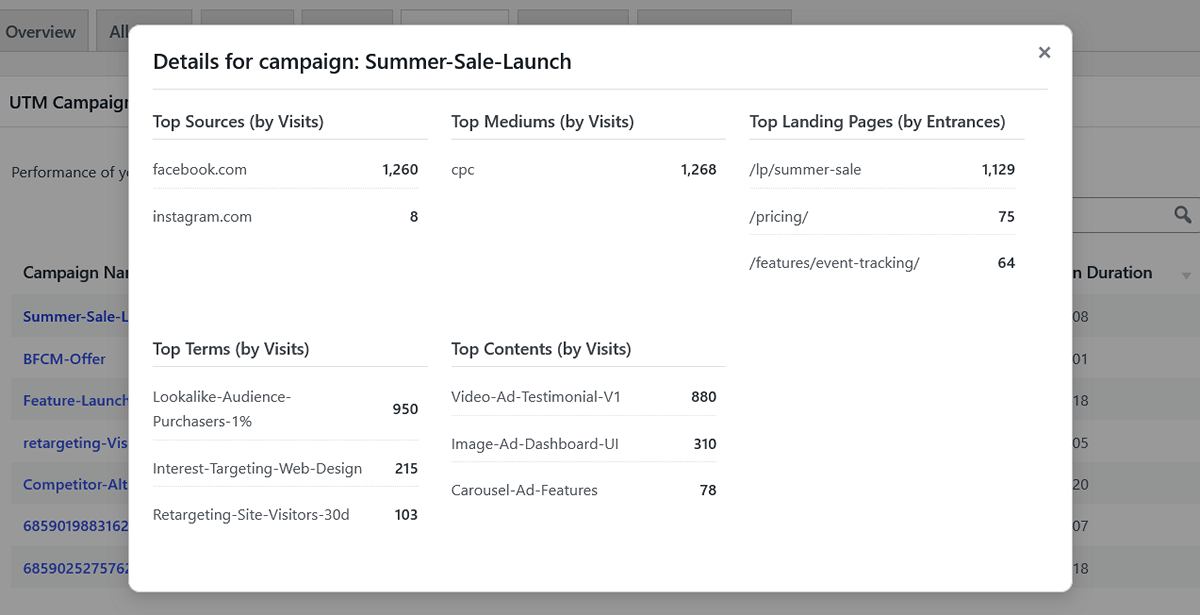
Campaign Details Modal
Clicking on a campaign’s name will open a modal window with a detailed breakdown of its performance, including:
- Top Sources & Mediums: See the utm_source and utm_medium tags that were most effective for this campaign.
- Top Landing Pages: Discover which of your landing pages performed best for this specific campaign.
- Top Terms & Contents: Analyze the performance of your utm_term and utm_content tags, which are often used for A/B testing ads or links.
Pro Tip: Seeing {{campaign_name}} in Your Reports?
If you see a campaign name in your report that looks like a placeholder (e.g., {{campaign.name}}, __CAMPAIGN_NAME__), it means the URL from your ad platform is sending the placeholder text itself, not replacing it with the actual campaign name.
This is an issue with the ad’s URL parameter setup, not the analytics plugin. To fix this, please review your ad’s “URL Parameters” or “Tracking Template” in your ad platform (like Google Ads or Facebook Ads) and ensure you are using the correct, officially supported dynamic insertion macro for that platform.
Advertising Tab
This report aggregates data from major paid advertising platforms, identified by their unique click identifiers (gclid for Google, fbclid for Facebook, etc.).
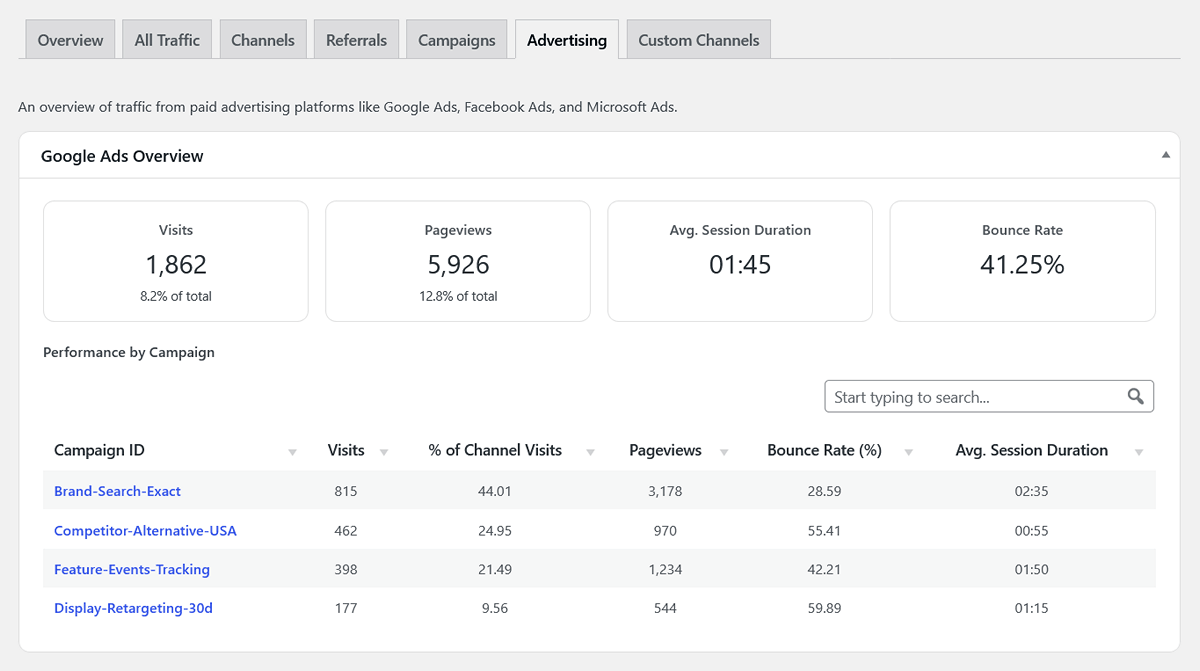
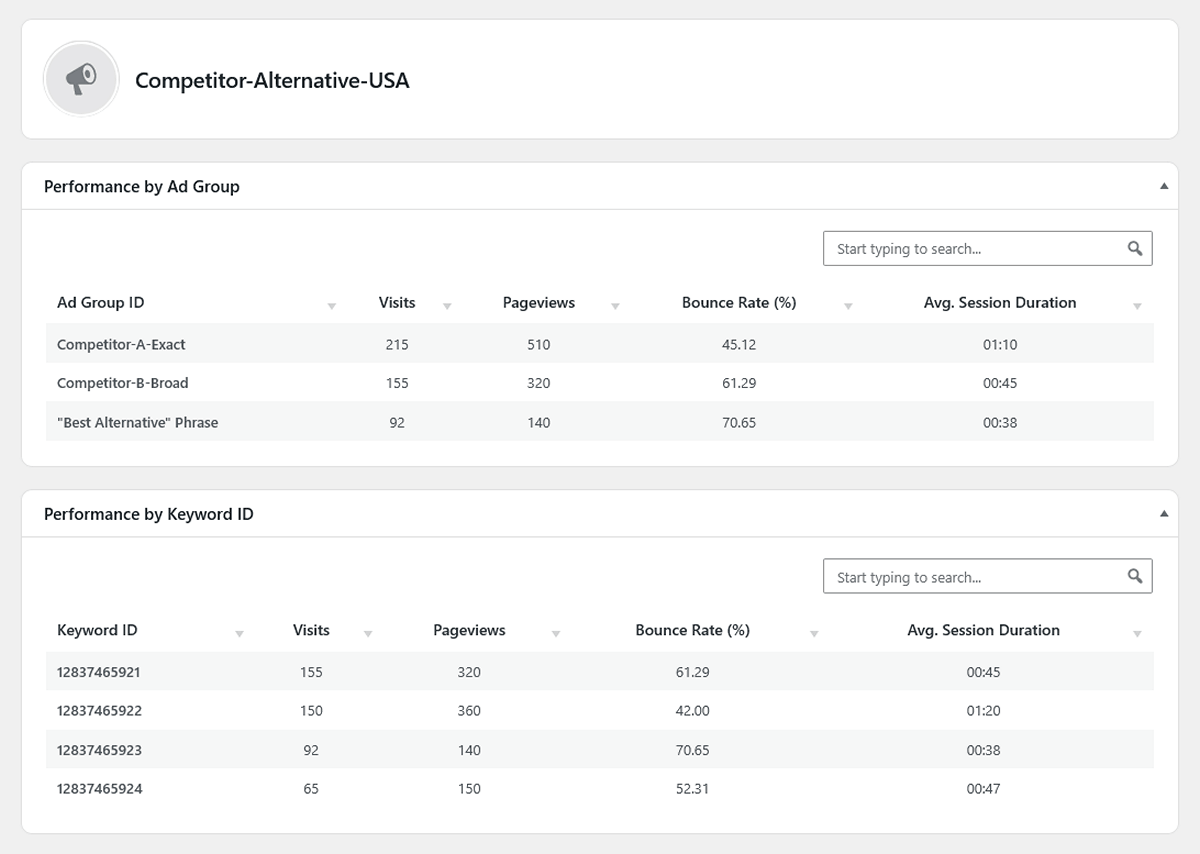
- Google Ads: Provides an overview of your total Google Ads traffic, plus a detailed table breaking down performance by Campaign ID. Each campaign name is a clickable link that opens a drill-down report showing performance by individual Ad Group and specific Keyword IDs within that campaign.
- Facebook Ads: Shows an overview of your Facebook Ads traffic and a list of the Top Landing Pages for those visitors.
- Microsoft Ads: Displays an overview of your Microsoft (Bing) Ads traffic and a list of the Top Landing Pages.
Custom Channels Tab
This report is for advanced tracking. It displays aggregated data for any custom URL parameters you’ve configured in Settings > Tracking Settings. This is ideal for tracking platforms that use their own unique identifiers, such as li_fat_id for LinkedIn or ttclid for TikTok.
The table shows you the total performance for each of these specific traffic sources tracked with custom parameter keys.
Next Steps
Now that you’ve analyzed how your visitors find your site, it’s time to learn about their on-site behavior. The Content Reports will show you which pages they engage with the most.