
Introducing WordPress-Native Content Analytics
Most analytics tools focus on one question: ‘What pages are my visitors looking at?’ For anyone seeking true WordPress content analytics, the most valuable insights go deeper. The questions that shape a content strategy are usually about the who and the why:
- Which authors create the most engaging content?
- Do blog posts perform better than static pages?
- Which topics drive the most traffic?
Answering these has traditionally been difficult because most analytics tools don’t understand the underlying structure of WordPress. They see URLs, not authors or taxonomies.
This update introduces a new set of reports designed to address this limitation. The feature is now available to all WP Insights Pro users.
Deeper WordPress Content Analytics: Authors, Post Types, and Taxonomies
This update adds three new reports to the “Content” section of your dashboard, each providing additional insight into your content performance.
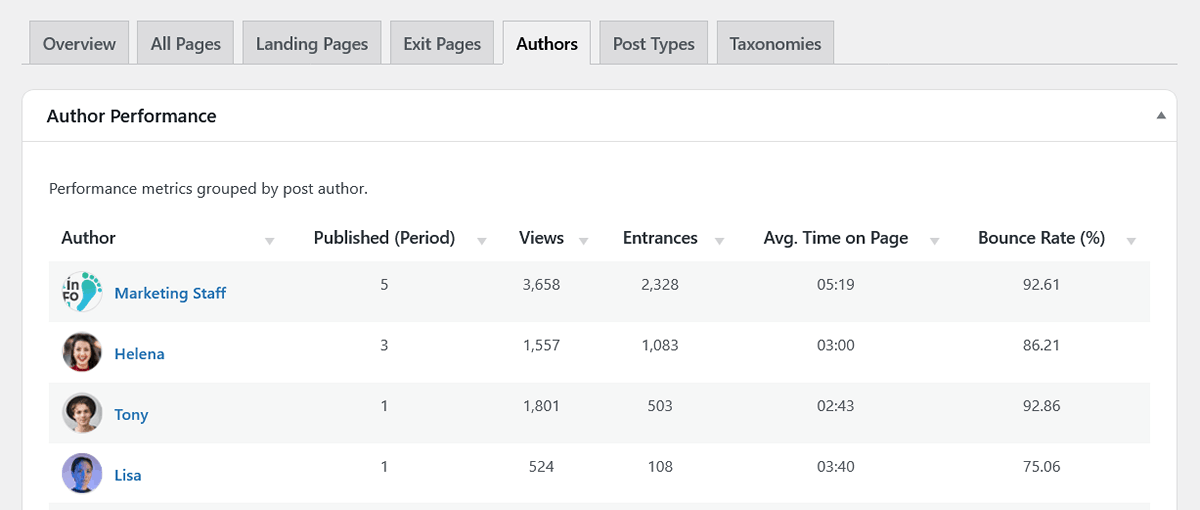
1. Author Performance Analytics
For multi-author blogs, news sites, or content teams, this provides a clear overview. The new “Authors” report shows how each author’s content performs.
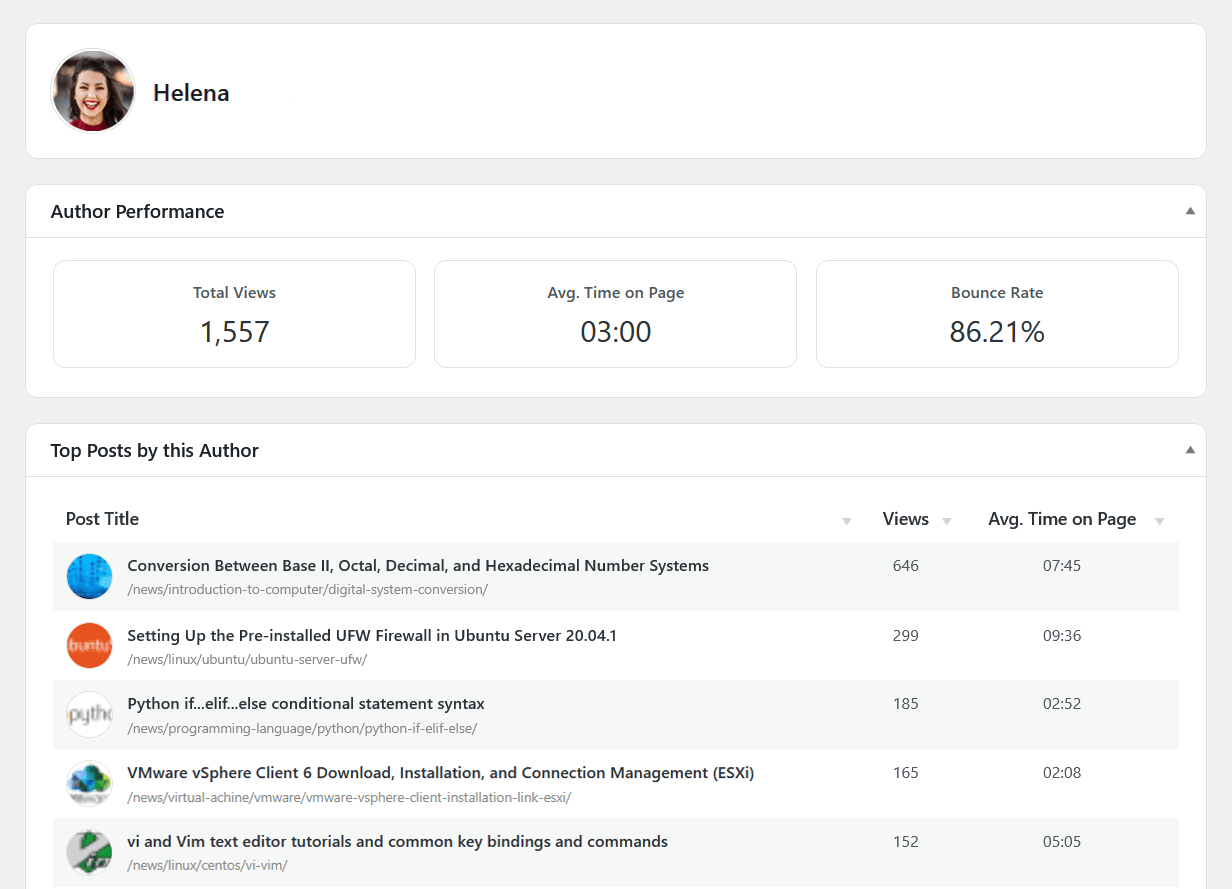
You can now see, at a glance, who your most effective writers are by comparing key metrics like Total Views, Average Time on Page, and Bounce Rate across all of their published content. The main table provides a clear summary, and you can click on any author to drill down into their individual dashboard for a more detailed look at their top-performing posts.
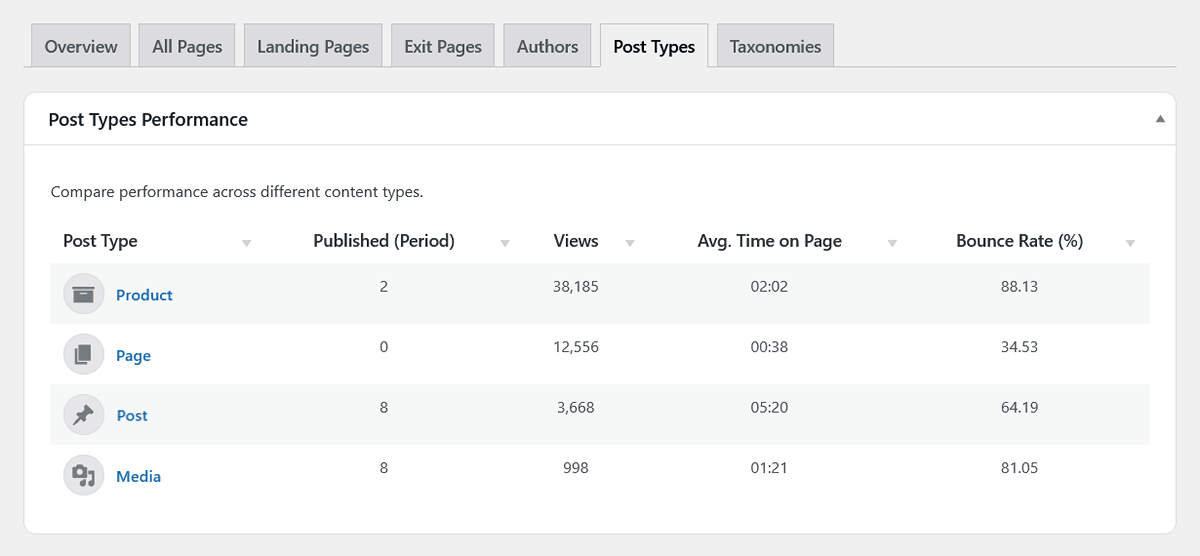
2. Post Type & Taxonomy Insights
WP Insights Pro now automatically detects and analyzes all of your content structures.
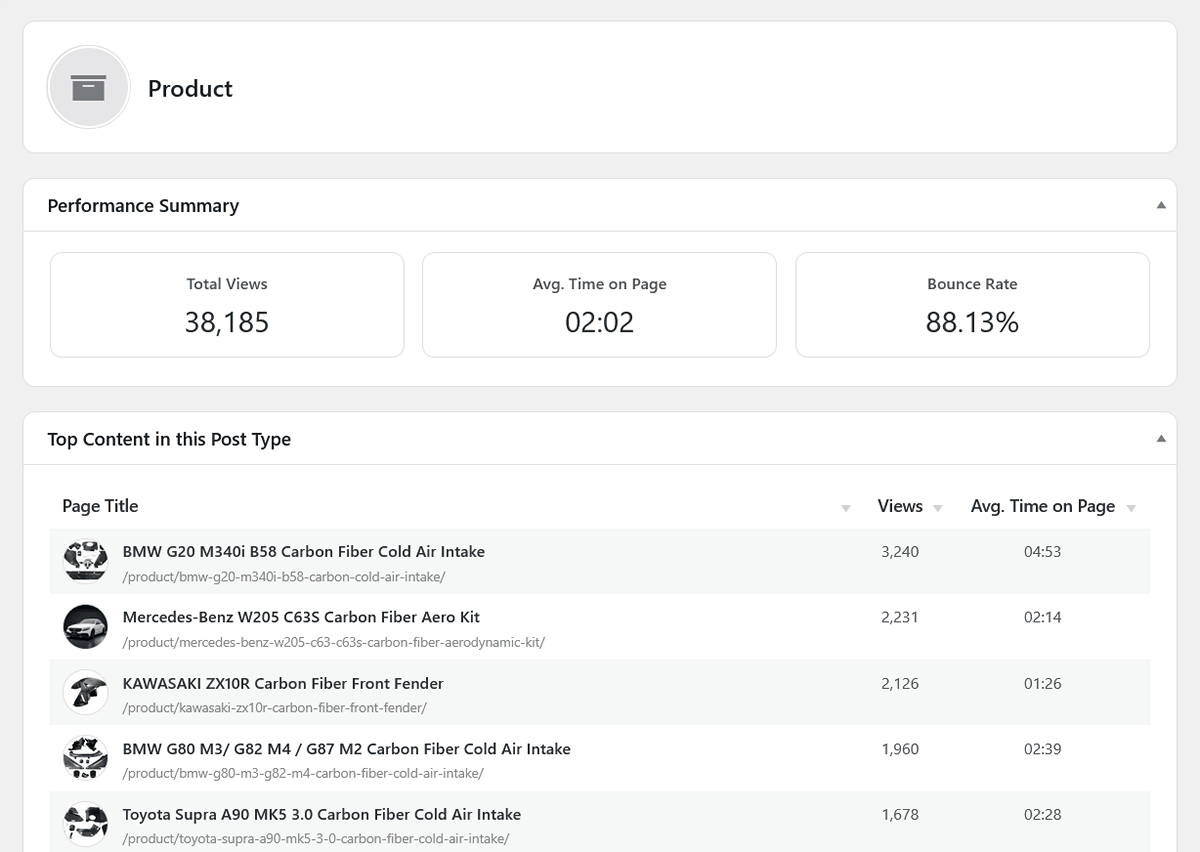
The new “Post Types” report lets you compare the performance of different content formats side-by-side, giving you actionable insights for your WordPress content analytics. Are your Posts getting more views than your Pages? How does engagement on your WooCommerce Products compare?
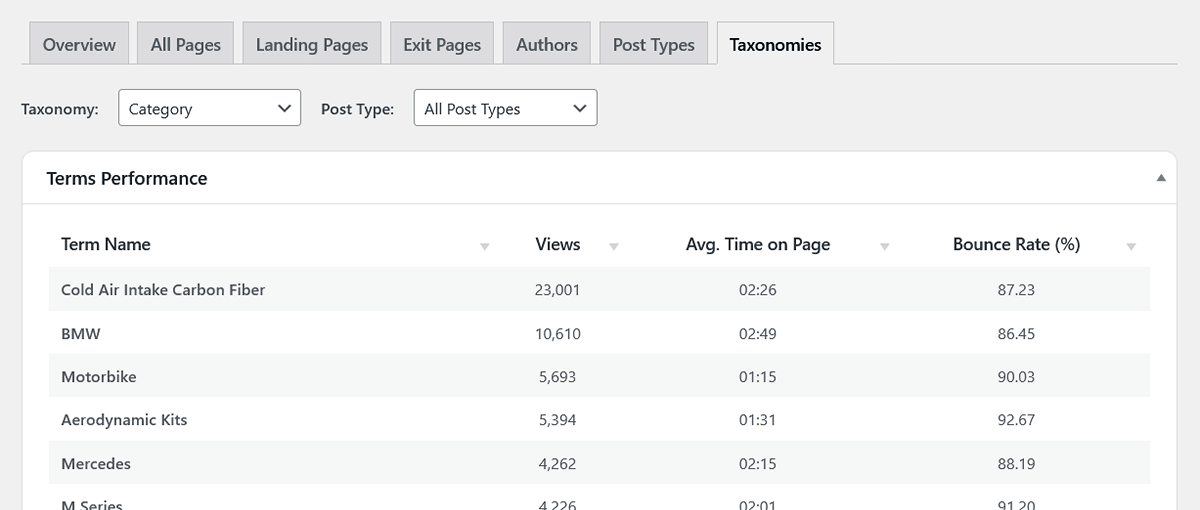
The “Taxonomies” report takes this a step further, allowing you to see which of your topics are resonating most with your audience. You can analyze the performance of any taxonomy—like Categories or Tags—and even filter the results by post type. This is a practical way to identify which topics attract the most engagement, helping you decide what to write about next.
A Richer Experience Across All Content Reports
Beyond the new tabs, we’ve also enriched the existing content reports to be more insightful. The “All Pages,” “Landing Pages,” and “Exit Pages” tables now include:
- Featured Image Thumbnails: A small thumbnail next to each post or page, making your reports more visual and easier to scan.
- Author Names: You can now see who wrote each piece of content directly in the main tables, giving you immediate context.
These additions improve clarity and usability, transforming your content reports into a more intuitive and visually rich experience.
Conclusion: Analytics That Understands WordPress
This update adds a new layer of reporting focused on how WordPress content is actually organized — by author, post type, and taxonomy. Instead of analyzing only URLs, you can now evaluate performance based on the structure that defines your site.
This provides a long-term, reliable framework for WordPress content analytics, built from the ground up with performance and privacy in mind.
For content-focused teams, this makes it easier to understand what works, what doesn’t, and where to focus next.
Ready for Zero-Bloat Analytics?