How to Find and Fix the Scripts That Are Slowing Down Your WordPress Site
Even with optimized images, a caching plugin, and a fast host, some WordPress sites can still load slowly. PageSpeed scores may remain low, and Google PageSpeed Insights may flag delays — leaving you with a slow WordPress site.
While the cause can vary — from heavy themes to complex plugins — one of the most common and often overlooked contributors is the collection of third-party JavaScripts added over time. Social sharing buttons, marketing pixels, and external analytics tools each create additional requests that can impact performance.
This guide focuses on that problem. We’ll walk you through a straightforward, non-technical process to identify which external scripts are slowing down your site and explain what to look for in a performance-focused tool.
Step 1: Run a Waterfall Analysis
First, we need to see exactly what’s loading on your page. You don’t need to be a developer to do this. Free tools like WebPageTest make it easy.
- Go to WebPageTest.org.
- Enter your website’s URL and run a test.
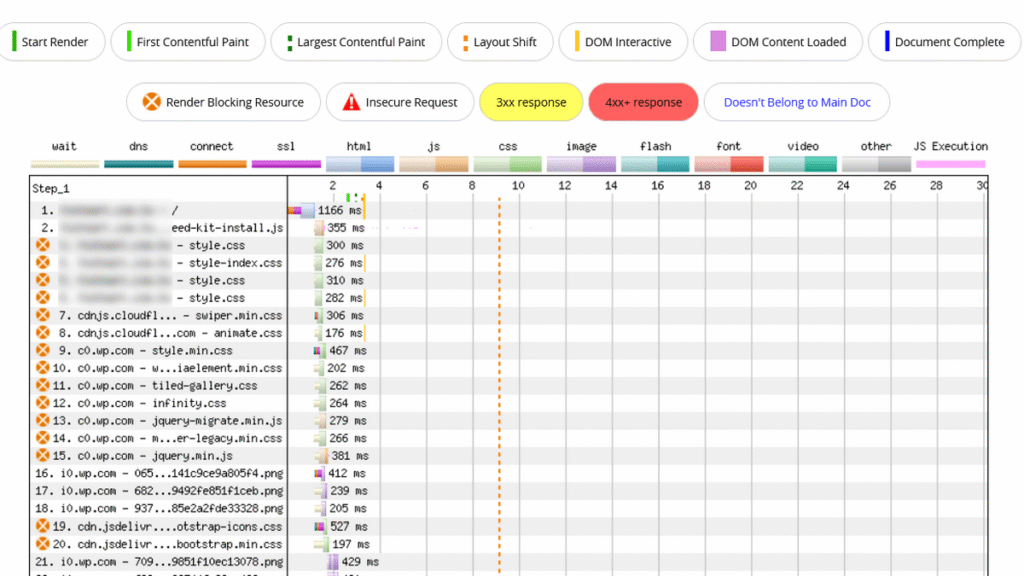
- Once the test is complete, click on the “Waterfall” view.
The waterfall chart is a visual timeline of everything your browser has to download to render your page. Each bar represents a file. The longer the bar, the more time it took to load. This is the key to diagnosing a slow WordPress site.
Step 2: Identify the Slow Third Party Scripts
Now, scan the “Domain” column in your waterfall chart. Look for domains that are not your own. These are your third-party scripts.
Pay close attention to scripts from:
- Analytics Services (e.g., google-analytics.com): Often one of the biggest offenders.
- Social Media Widgets (e.g., connect.facebook.net): The code needed to render a simple “Like” button can be surprisingly heavy.
- Ad Networks & Marketing Pixels: Notorious for slowing down sites.
Let’s check an example:
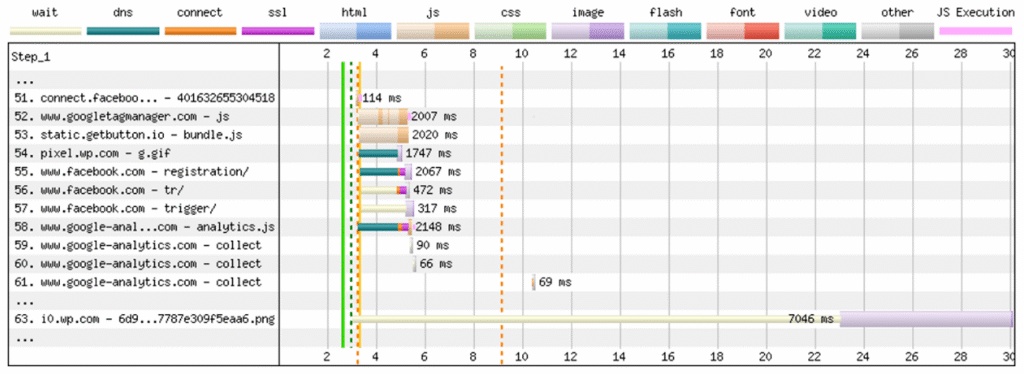
- The Google Analytics request (and others) took around 2 seconds to fully load — not critical, but it still adds drag to your performance.
- The external PNG image from i0.wp.com took a shocking 7+ seconds just to respond (TTFB), even though the file itself was tiny.
These are classic examples of how third-party resources can hurt your load times in very different ways.
Step 3: Fix External Requests When Possible
Whenever possible, replace calls to third-party domains with versions hosted on your own server.
For example, in the previous case the PNG was being delivered through i0.wp.com, which is part of Jetpack’s image CDN. While it’s meant to speed things up, it can sometimes respond very slowly depending on the region. A simple fix is to serve the image directly from your own domain, this removes an external dependency, reduces TTFB, and ensures your page loads more consistently.
Step 4: Choose Performance-First Tools
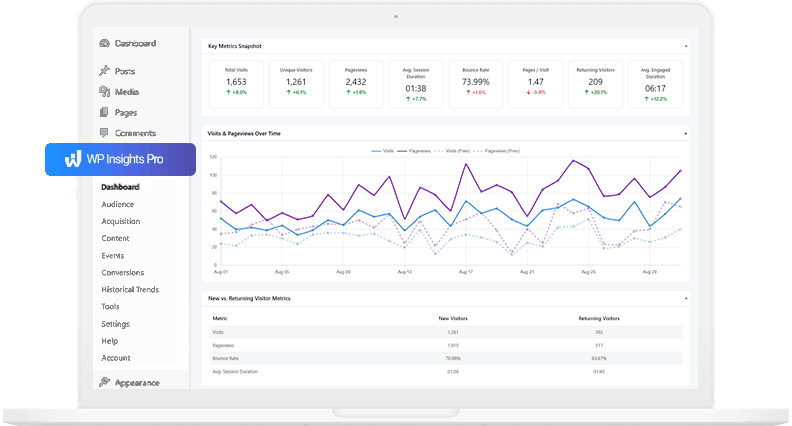
This is where the philosophy behind WP Insights Pro comes in. We believe you should never have to make a trade-off, especially for something as essential as analytics.
Our tracking script (wpip-front.js) was engineered to be virtually invisible in a waterfall test. Here’s what that looks like:
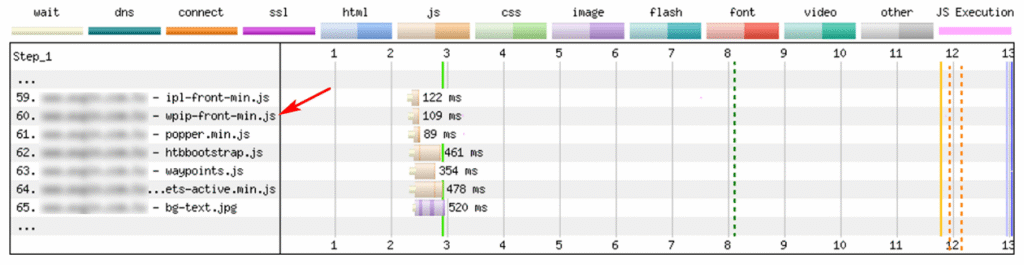
Notice the difference:
- It’s Tiny: The file size is small (under 10KB).
- It’s Fast: It loads quickly.
- It’s From Your Domain: The request stays on your server, avoiding external delays.
- It’s Non-Blocking: It loads asynchronously and doesn’t block main content.
Conclusion: Audit Your Tools, Choose Them Wisely
A slow WordPress site isn’t inevitable. Running a waterfall test can reveal the sources of delays.
When selecting tools for your site, especially analytics, look for solutions designed with performance in mind. Your visitors — and your site’s reliability — will benefit.
Ready for Zero-Bloat Analytics?